More cash from the same collection team — by acting where effort changes the outcome
Mid-market and enterprise finance teams carry large overdue balances and a fixed number of collector-hours. The prevailing playbook — work the oldest invoice or the biggest balance — spends that scarce time on accounts that would have paid anyway, and on accounts no outreach will move. The Cash Recovery Engine reallocates the same hours to the moveable middle, the invoices where a call measurably raises the odds of payment.
Collection capacity is finite. Most of it is spent in the wrong place.
Every dollar trapped in overdue receivables is working capital that cannot fund payroll, inventory, or growth. Days Sales Outstanding (DSO) is the headline metric finance is measured on — yet the levers to move it are blunt.
Collectors triage by intuition or by simple rules. Oldest-first (FIFO) chases aging that may be uncollectible. Largest-first burns hours on a handful of complex, dispute-laden accounts. Neither asks the only question that matters for ROI: where does an hour of effort actually convert to cash?
The result is predictable — cash that could arrive this quarter arrives next quarter, or never; collector time is consumed by accounts that would have self-cured; and leadership has no defensible way to size the opportunity being left on the table.
Effort is mispriced
Large balances cost disproportionately more to collect (negotiation, approvals, disputes) — but conventional worklists ignore effort entirely.
Wasted touches
A large share of invoices self-cure. Working them adds cost, not cash.
No causal view
Teams rank by "who is late," not by "whom can we actually move" — the question uplift answers.
Unquantified upside
Without a model, the recoverable opportunity and the cost of the status quo are invisible to the CFO.
Four reasoning steps, one ranked worklist
This is decision intelligence, not a CRUD dashboard. The ranking cannot be reproduced by sorting any single column — it is the joint output of two learned models and a constrained optimizer.
Who pays anyway?
A calibrated logistic model estimates each invoice's probability of paying within the horizon with no action — the self-cure rate (ECE 0.018).
Whom can we move?
A second model estimates pay-if-worked. The uplift between the two isolates the moveable middle — where a collector hour converts to cash.
Where do hours go?
A capacity-constrained optimizer (0/1 knapsack) fills the collector-hours budget by expected cash per hour, pricing in the effort big balances truly cost.
What's the play?
Every invoice gets a recovery segment — Persuadable, Self-Cure, At-Risk, Critical — and a recommended action, in a downloadable worklist.
Same hours, materially more cash
Measured on a held-out benchmark ledger under an identical, binding 200-hour budget. Every strategy faces the same invoices, the same effort costs, and the same budget; only the prioritization differs.
| Prioritization strategy | Cash recovered (equal hours) | Relative to Engine |
|---|---|---|
| Cash Recovery Engine (uplift × $/hour) | $1,665,446 | 1.00× |
| Largest balance first | $733,603 | 0.44× |
| FIFO (oldest first) | $565,742 | 0.34× |
| Random | $454,269 | 0.27× |
Illustrative single-portfolio projection: on a $19.01M open ledger (900 invoices), an 80-hour week directs effort to 61 invoices and projects $524K of cash acceleration (model estimate, not realized cash — see Proof Layer).
A deterministic pipeline behind a non-bypassable proof gate
Dependency-free and seeded end to end, so every figure is reproducible and auditable.
Ingest
Resolved history + open ledger (CSV / ERP export). Observable fields only.
Engineer
Aging, balance, dispute, customer payment history, credit health.
Propensity + Uplift
T-learner: self-cure vs. pay-if-worked → per-invoice uplift.
Allocate
Constrained knapsack on expected cash per collector-hour.
Worklist + Reports
Ranked CSV, JSON, executive summary, live console.
The decision console
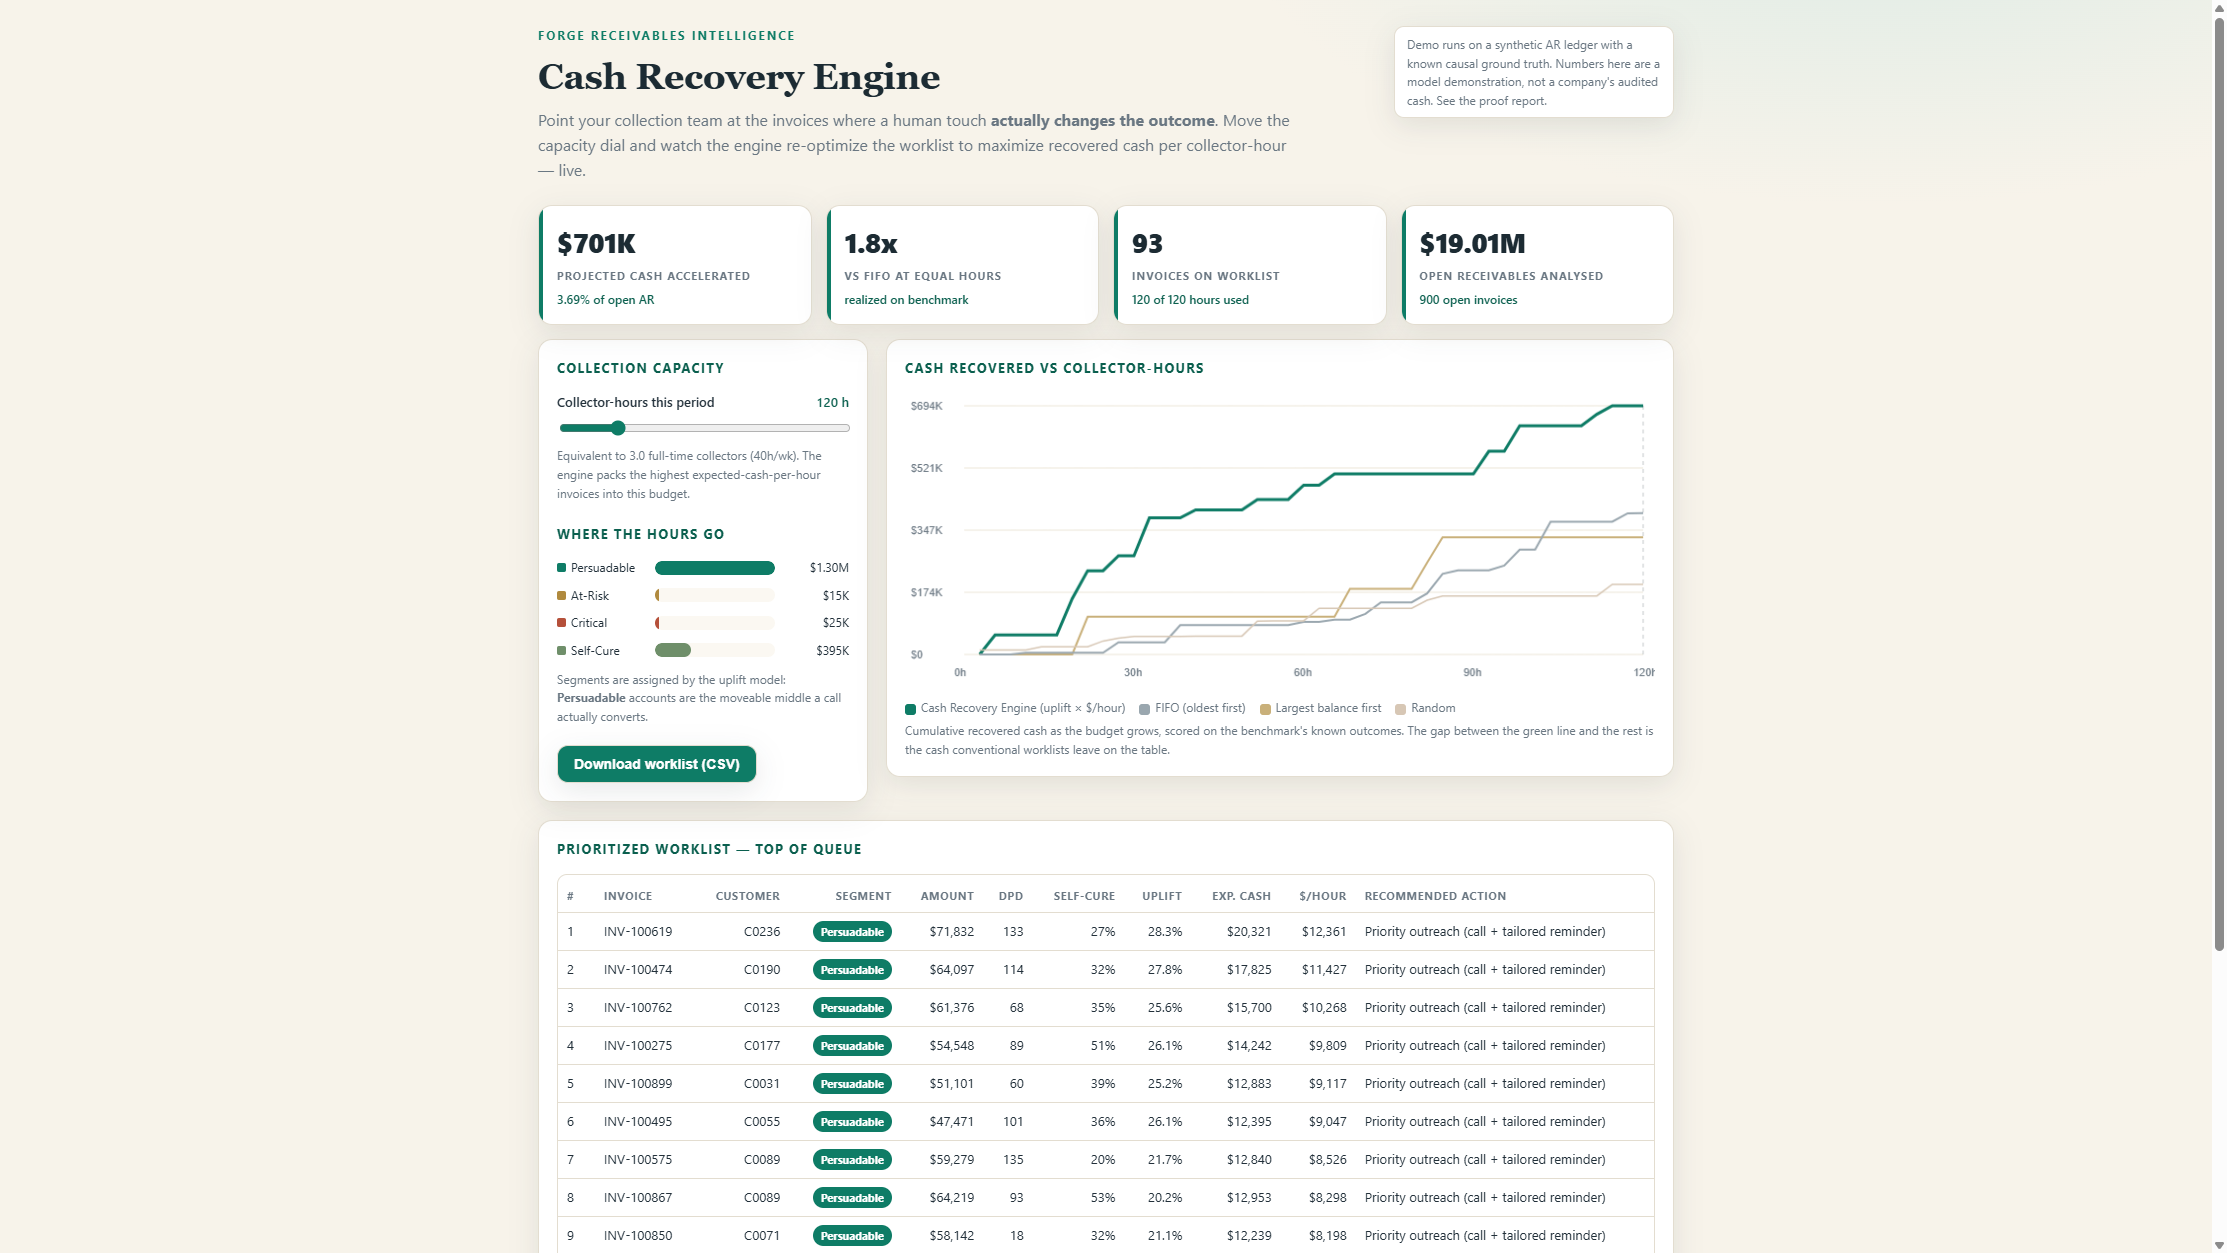
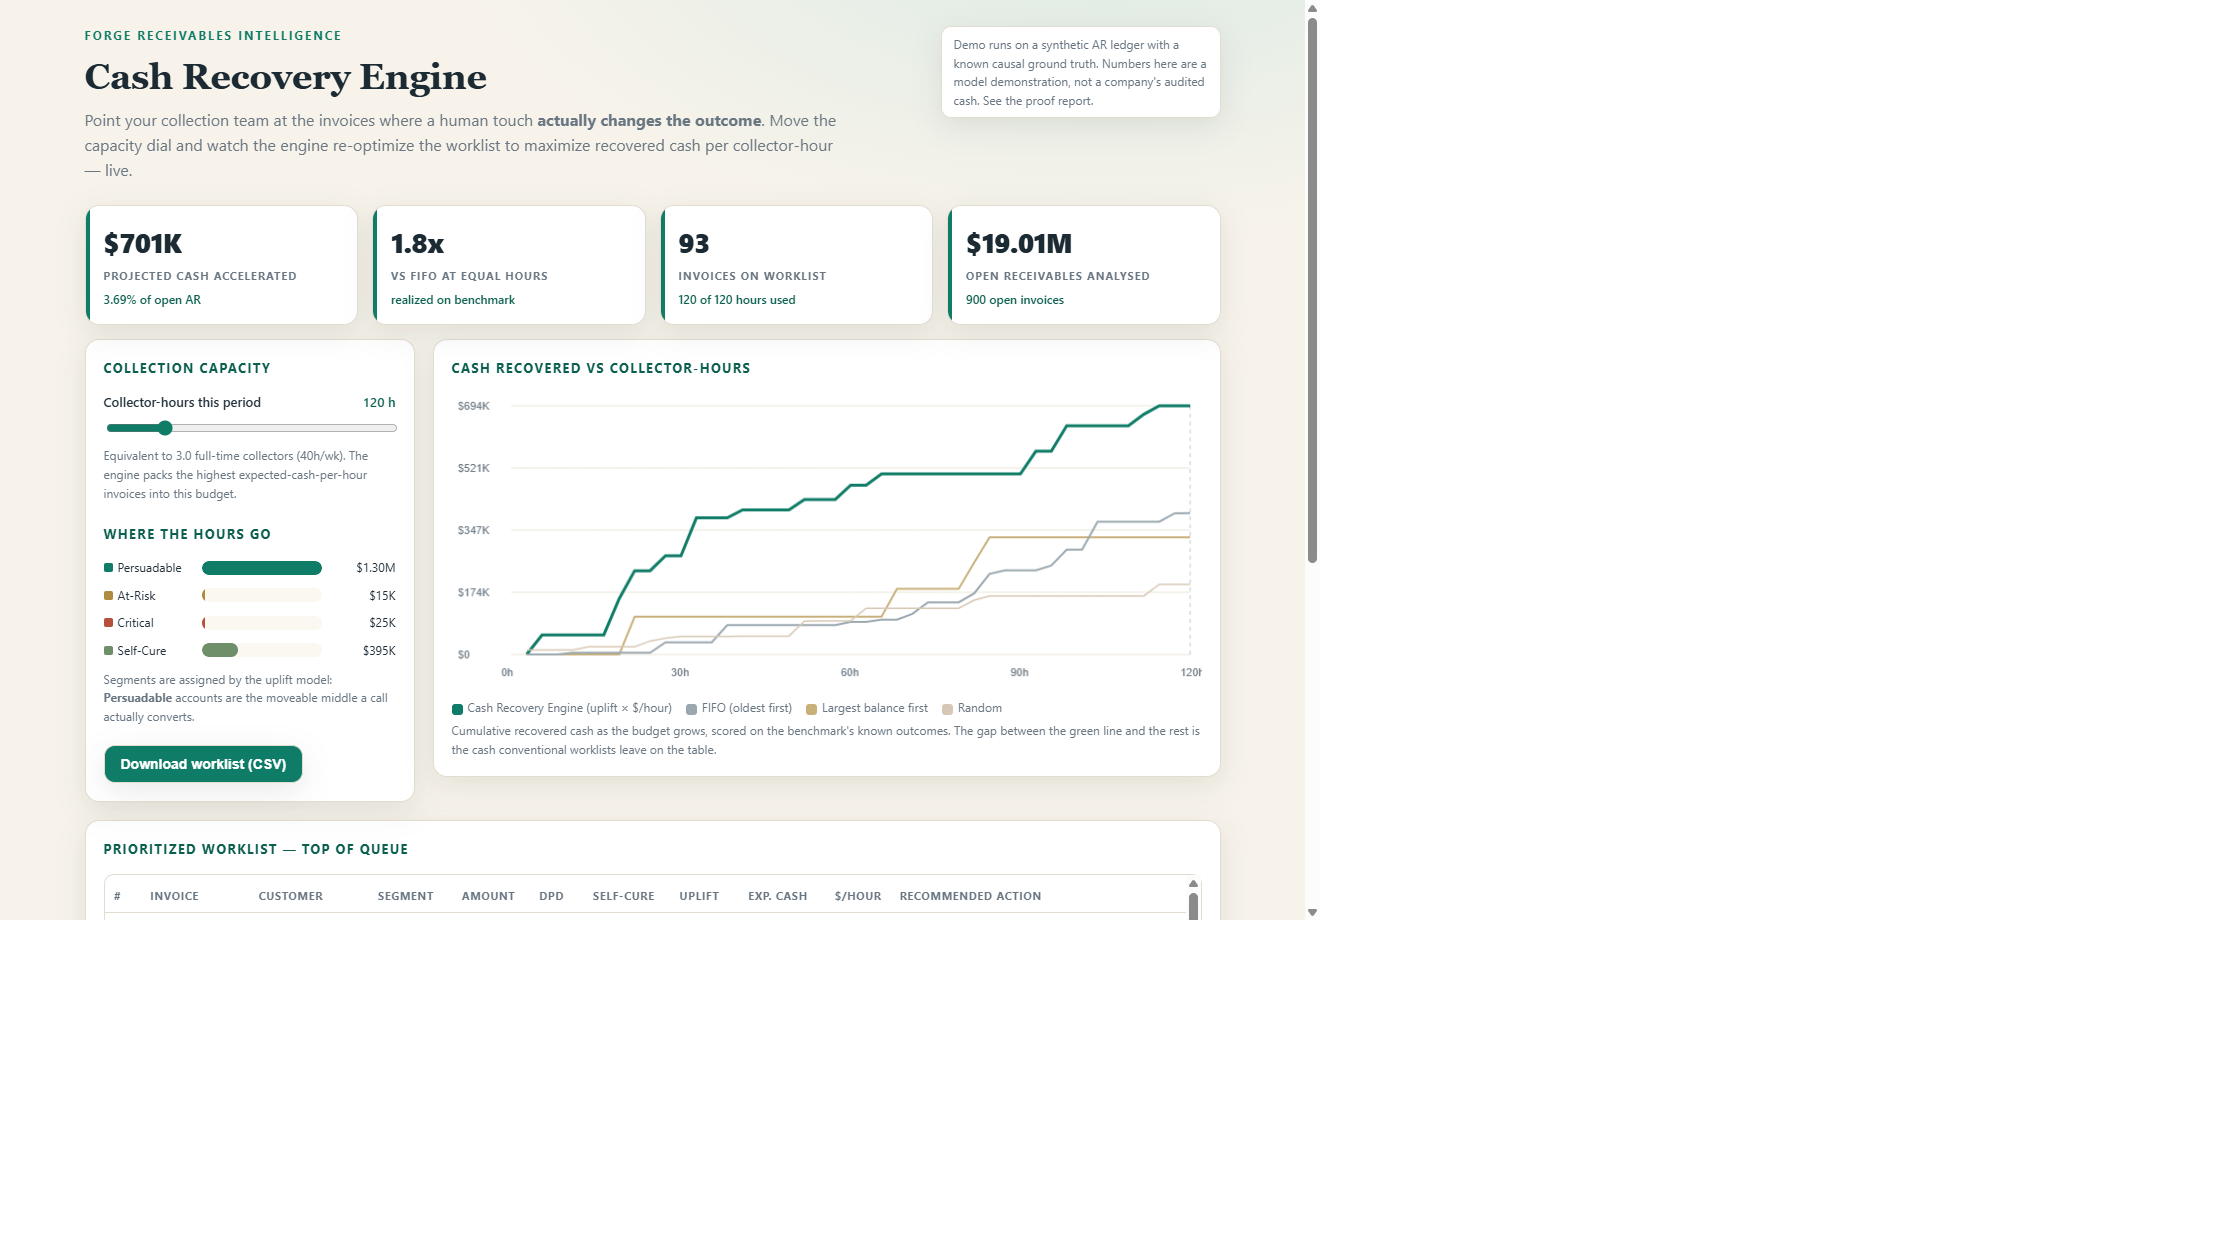
Move the capacity dial — watch the engine re-optimize
A live, in-page instance running on a verified synthetic ledger. Drag the collector-hours dial and the worklist, KPIs, recovery curve, and segment mix recompute instantly with the same deterministic optimizer that ships in the engine.
Model quality and decision quality
| Metric | Value | What it tells you |
|---|---|---|
| Payment-propensity AUC (held-out) | 0.8173 | Ranks payers above non-payers well above chance |
| Calibration — ECE | 0.018 | Predicted probabilities match observed frequencies |
| Calibration — Brier | 0.1588 | Mean squared error of probabilistic predictions |
| Skill vs. strongest baseline | +127% | Extra cash from uplift-aware allocation |
| Lift vs. FIFO (equal hours) | 2.9× | Improvement over the most common worklist |
| Capture of movable-cash ceiling | 49% | Budget efficiency vs. theoretical maximum |
| Training data / held-out test | 4000 / 1500 | Trained and evaluated on disjoint ledgers |
| Train time | 134 ms | Fast, deterministic, dependency-free |
13 / 13 automated checks — all passing
Run with node verify.mjs. Structural checks validate the learner, metrics, causal world, and optimizer feasibility; benchmark checks validate ranking, calibration, and head-to-head cash recovery on held-out data.
| Result | Check | Detail |
|---|---|---|
| PASS | Logistic learner recovers a separable signal (acc > 0.95) | train acc=1 |
| PASS | AUC helper returns 1.0 for a perfectly ranked set | auc=1 |
| PASS | Potential outcomes monotone: y1 >= y0 for every invoice | 0 violations / 2000 |
| PASS | Capacity-constrained worklist never exceeds the hours budget | used 59.92h <= cap 60h, 59 invoices |
| PASS | [synthetic] Self-cure propensity ranks better than chance (AUC > 0.70) | AUC=0.8173 |
| PASS | [synthetic] Self-cure probabilities are calibrated (ECE < 0.05) | ECE=0.018, Brier=0.1588 |
| PASS | [synthetic] Engine beats best simple baseline by >40% cash recovered | engine=$1,665,446 vs best baseline=$733,603 (skill 127.0%) |
| PASS | [synthetic] Engine recovers >=2x the cash of FIFO at equal hours | 2.94x FIFO |
| PASS | [synthetic] Engine captures >35% of the movable-cash ceiling within budget | 48.7% of $3,417,896 using 200h |
| PASS | Reproducible: same seeds -> identical AUC | 0.8173 == 0.8173 |
| PASS | Trains the uplift model end-to-end in < 8 s | 134 ms on 4000 historical invoices |
| PASS | Engine emits a complete, budget-feasible worklist schema | rows=58 fields✓=true hours=80<=80 cash>=0=true |
| PASS | Official dataset evaluation (drop data/official/{history,open}.csv to enable) | official data not present — synthetic benchmark only |
Independently verifiable, deliberately honest
The Forge Proof Layer (IRS_AUDITOR standard) has final authority over the posture below. It is not hand-set, and it cannot be overridden by any other subsystem.
Disclosed seams (6)
Why this is PROOF_INCOMPLETE and not CERTIFIED: no real customer ledger is present, so a company-specific recovery figure is a disclosed seam that contradicts a certified claim — by design.
- No real customer AR ledger is present in this workspace; all reported numbers are measured on a synthetic, behaviourally-motivated benchmark (src/synth.mjs), not on any company's receivables.
- Individual treatment uplift is measurable here only because the synthetic world exposes BOTH potential outcomes (y0 and y1). On real data you can never observe both for the same invoice, so production
- Simulated — Collector effort hours and days-to-pay are modelled parameters, not timed observations.
- Projection — "Cash accelerated" and "collection-days reduction" are model projections over this ledger, not realized, audited cash movements.
- Official evaluation path present but inactive (no data/official/ inputs this run).
- Customer outcome: No real customer AR ledger is present; company-specific cash recovery is not produced (synthetic benchmark only).
A complete, machine-checkable evidence trail
Generated by the Proof Layer and shipped inside the delivery package. Raw run logs are preserved under proof/evidence/.
Everything handed over
Documentation, runnable source, the verification suite, the live tool, downloadable reports, and the full proof package — all in one signed delivery archive.
Overview
What it is and how to run it
Outcome Contract
Scope, honest constraints, success criteria
User Guide
From zero to a prioritized worklist
Verification Report
13/13 checks + benchmark
Proof Report
Status (PROOF_INCOMPLETE), evidence lineage, disclosed seams
Executive Evidence
Answers the 10 IRS_AUDITOR questions
Evidence Grade
Grade B basis + signals
Auditor Challenge
Hostile interrogation of every major claim
Auditor Objections
Pre-written objections + responses
Limitations
Seams / simulations / projections
Reproduce
Exact commands to reproduce every number
Verify
How verification runs + what each check asserts
Run & Deploy
Local run + bring-your-own-data schema
Release Notes
v1.0.0 summary
Prioritized worklist (CSV)
Ranked queue with segment, uplift, expected cash and $/hour — exportable from the live tool.
Executive summary & engine output (JSON)
One-page CFO summary plus the full structured result for downstream systems.
delivery-package.zip ↓
Source, docs, proof, reports and evidence in a single archive.
Lean by design
Runtime & engineering
Deterministic, dependency-free, runs anywhere with Node — no network, no native modules, no build step.
Modeling & optimization
Calibrated logistic propensity, a T-learner uplift model, and a greedy-ratio 0/1 knapsack allocator.
Evaluation
Rank-based AUC, Brier and ECE calibration, and head-to-head realized-cash comparison against baselines.
Interface & proof
A framework-free Canvas console mirroring the engine, plus the IRS_AUDITOR proof toolchain.
Run it in minutes; bring your own data when ready
Local run
cd delivery-package/cash-recovery-engine
node run.mjs      # train + score; writes reports/ + tool data
node verify.mjs   # 13/13 checks; writes verification-report.*
# open public/tool.html in a browser
The tool is static — serve public/ from any host or CDN. No server runtime required.
Bring your own ledger
Drop two CSVs into data/official/ and re-run verification — the identical checks evaluate your data.
data/official/history.csv  # resolved invoices
data/official/open.csv     # live open invoices
node verify.mjs            # official block runs
Full schema and ERP field mapping in the Run & Deploy guide.
What the build surfaced
Effort is the hidden variable
Ranking by cash alone loses to ranking by cash-per-hour: large balances cost disproportionately more to collect, so pricing in effort is where most of the lift comes from.
Uplift beats propensity
Chasing likely payers wastes hours. Targeting the moveable middle — high treatment effect, not high payment probability — is what converts effort to cash.
Calibration earns trust
A decision tool needs probabilities that mean what they say. An ECE of 0.018 is what lets a controller act on a number rather than argue with it.
Causal honesty from day one
Individual uplift is never observable on real data. Designing for holdout / A-B validation up front is the only credible path to attributing recovered cash.
From verified prototype to closed-loop treasury system
Real-ledger validation
- Ingest a real AR export; score in shadow mode alongside the current process.
- Run an A-B / holdout: engine queue vs. business-as-usual; measure realized cash and DSO.
- Re-run the Proof Layer on real evidence to retire the data seam.
System-of-record connectors
- Connectors for NetSuite, SAP, Oracle, QuickBooks; nightly scoring.
- Role-based worklists pushed into the collections workflow.
- Identity, access control, and tenant isolation.
Orchestrated outreach
- Automated dunning sequences and payment-plan offers, human-in-the-loop.
- Dispute detection and routing; credit-hold recommendations.
Continuous learning
- Outcome capture, scheduled retraining, drift and calibration monitoring.
- Uplift re-estimation from ongoing randomized holdouts.
Working-capital optimization
- Cash-flow forecasting and portfolio-level capital optimization.
- Dynamic credit limits and customer-level risk policy.
Honest scope. No real customer receivables ledger is present in this environment, so no company-specific recovery figure is claimed. Every metric on this page is measured on a synthetic AR benchmark with a known causal ground truth (AUC 0.8173, ECE 0.018, +127% vs. the strongest baseline, 2.9× FIFO). Projected cash figures are model estimates, not realized cash. See the proof report and limitations.
Delivery metrics
Tokens, elapsed time, and cost for producing this outcome. Basis: Estimated — reproducible model over this outcome’s published artifacts. metrics.json
Cost and tokens are estimates derived deterministically from published artifacts and representative list pricing; actual billing may differ. Model basis: claude-sonnet-class (representative).